Dividend Growth Investing: The Mathematical Blueprint for Compounding Cash Flow
An institutional guide to dividend growth investing (DGI), evaluating free cash flow payout ratios, selecting Dividend Aristocrats, and automating DRIP compounding for multi-decade wealth.
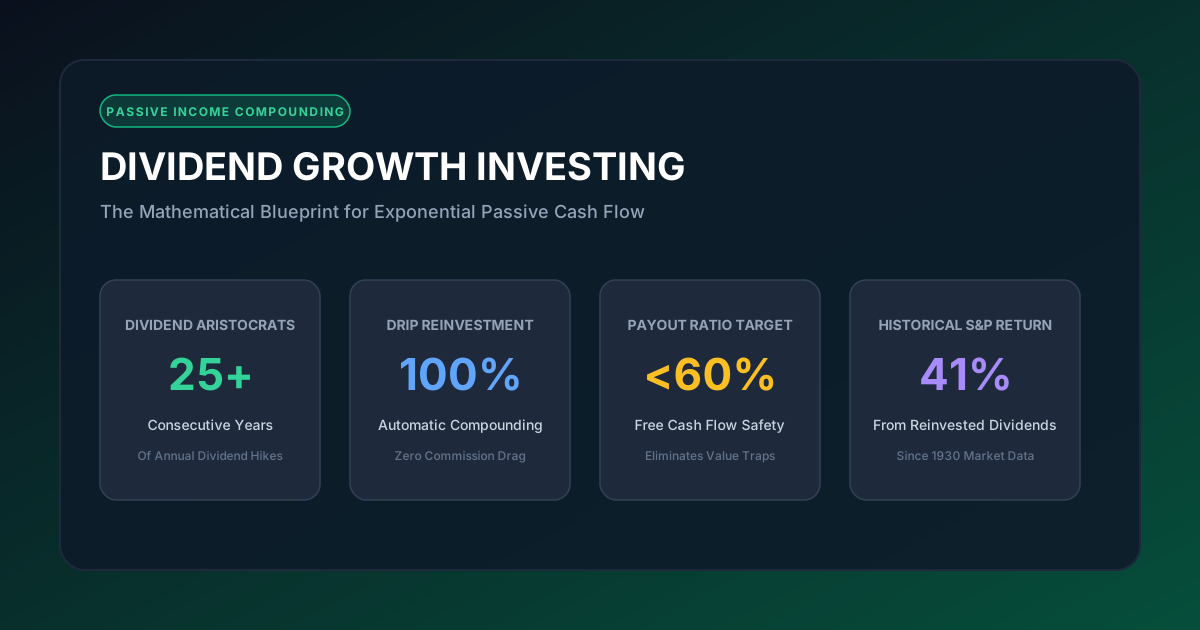
Dividend Growth Investing: The Mathematical Blueprint for Compounding Cash Flow
When building long-term equity wealth, retail investors frequently gravitate toward speculative capital gains or excessively high dividend yields. Both approaches carry structural risks: capital gains demand selling the underlying asset to generate cash flow, while double-digit dividend yields often indicate distressed corporations headed toward dividend cuts and capital destruction.
The premier alternative utilized by institutional allocators is Dividend Growth Investing (DGI). Rather than prioritizing current headline yield, DGI targets companies with robust competitive moats, pristine balance sheets, and expanding free cash flow (FCF) that consistently raise cash distributions year after year.
Figure 1: Core pillars of the dividend growth discipline. Sustained compounding requires high free cash flow coverage, defensive sector allocations, and disciplined DRIP reinvestment.
1. The Total Return Engine: Reinvested Dividends
The financial media focuses on the daily point fluctuations of the S&P 500 index. However, empirical market data across nine decades reveals that the vast majority of real equity compounding is driven not by price fluctuation alone, but by dividend payments and their continuous reinvestment.
According to historical research conducted by Hartford Funds and Ned Davis Research spanning 1930 through 2024:
- Reinvested dividends and compounding accounted for approximately 69% of the total cumulative return of the S&P 500 over that multi-generational span.
- During inflationary decades (such as the 1970s and 2020s), dividend payments represented over 75% of total real equity returns.
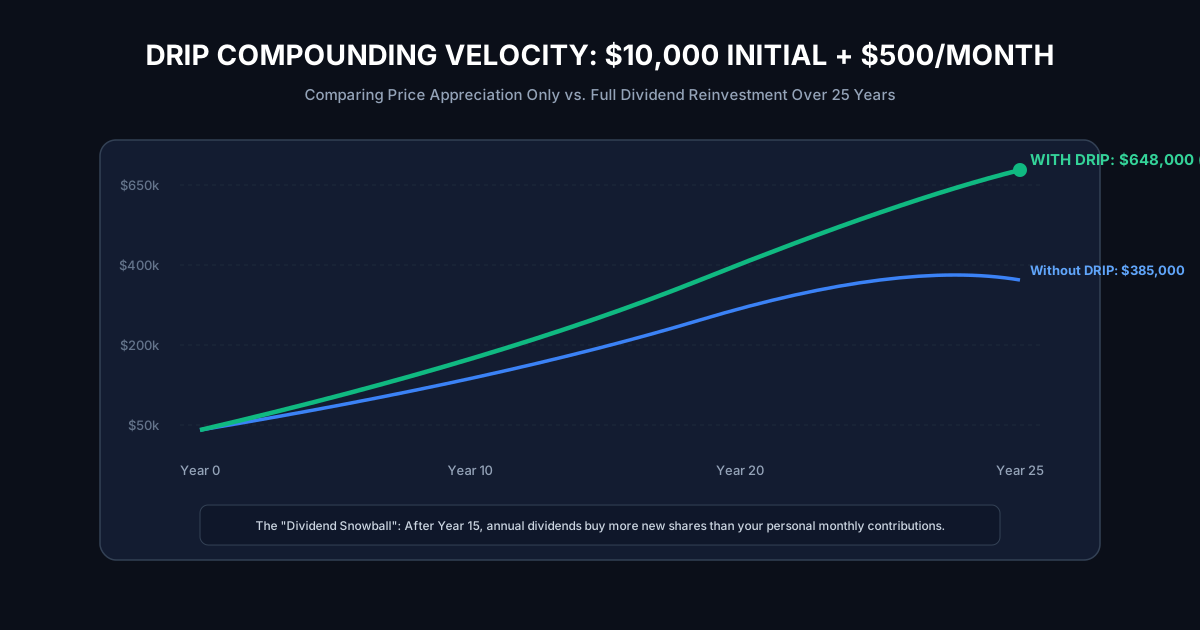 Figure 2: The exponential velocity of dividend reinvestment (DRIP). Reinvesting compounding quarterly distributions generates over $263,000 in additional wealth compared to price appreciation alone.
The Dividend Snowball Effect
When an investor enrolls in an automated Dividend Reinvestment Plan (DRIP):
- In Year 1, dividends purchase small fractional shares.
- In Year 5, those newly acquired shares generate their own dividend distributions.
- By Year 15, the annual organic dividend cash flow exceeds the investor's original out-of-pocket contributions. The portfolio functions as an independent compounding cash machine, acquiring more shares during bear market selloffs and accelerating during economic expansions.
2. Yield on Cost (YOC): The True Metric of Wealth
A common misconception regarding dividend growth stocks is that their starting yield—typically 2.0% to 3.5%—is too modest to build meaningful wealth. This mistake overlooks the mathematical power of Yield on Cost (YOC).
Yield on Cost measures the current annual cash dividend divided by the original purchase price of the shares: $$ ext{Yield on Cost} = rac{ ext{Current Annual Dividend per Share}}{ ext{Original Purchase Price per Share}}$$
Real-World Historical Case Study: AbbVie (ABBV)
Consider an investor who purchased shares of biopharmaceutical leader AbbVie in early 2014 at a split-adjusted cost basis of roughly $50 per share.
- In 2014, AbbVie paid an annualized dividend of $1.68 per share (a starting yield of roughly 3.36%).
- Over the ensuing decade, management leveraged its massive operating cash flow to raise the dividend every single year.
- By 2024, AbbVie's annual dividend reached $6.20 per share.
While an investor buying AbbVie today at $180 receives a prevailing market yield of approximately 3.4%, the original 2014 investor is collecting $6.20 on their original $50 cost basis: $$ ext{Yield on Cost (2024)} = rac{$6.20}{$50.00} = 12.4%$$
The investor now receives an annual, risk-free cash return of 12.4% on their invested capital, which increases every year, alongside triple-digit capital appreciation. This is the structural reality of dividend growth.
3. Dissecting the Balance Sheet: Evaluating the Payout Ratio
The single most crucial analytical metric in dividend investing is the Payout Ratio. An unsustainable payout ratio is the earliest warning sign of an impending dividend cut, which almost invariably triggers a collapse in share price.
Traditional financial platforms calculate the payout ratio based on net accounting income (Earnings Per Share, or EPS). However, GAAP earnings are distorted by non-cash charges, asset write-downs, and depreciation schedules. Institutional analysts evaluate the Free Cash Flow (FCF) Payout Ratio: $$ ext{FCF Payout Ratio} = rac{ ext{Total Cash Dividends Paid}}{ ext{Cash Flow from Operations} - ext{Capital Expenditures}}$$
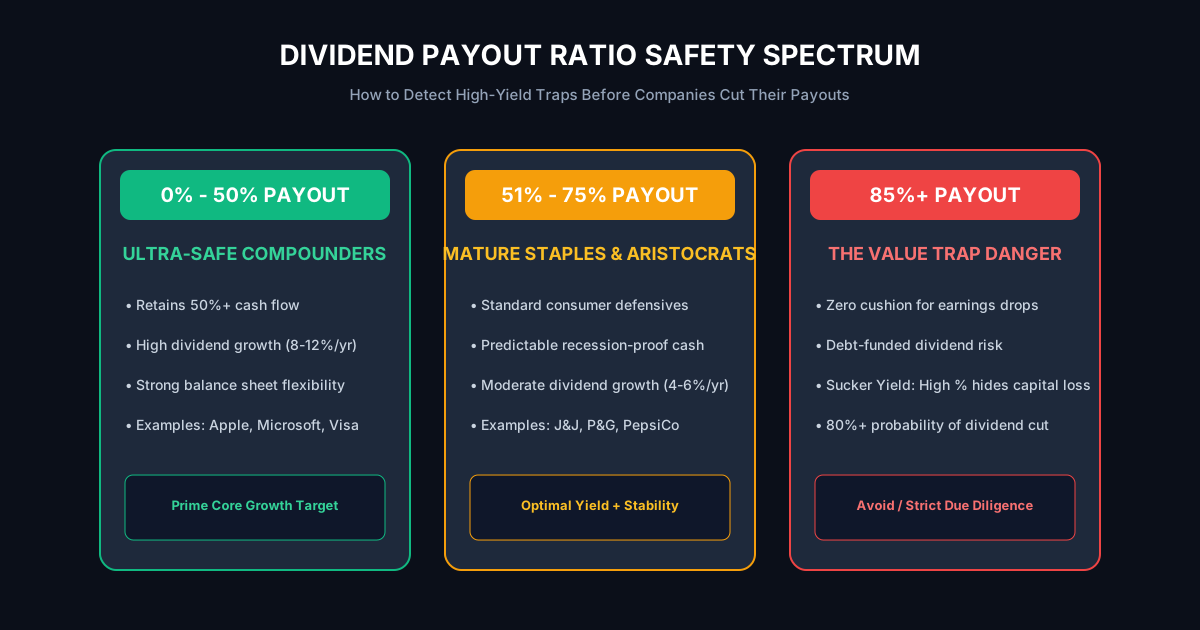 Figure 3: Payout ratio health spectrum. Focusing on the sweet spot under 65% of free cash flow insulates capital from dividend cuts while funding corporate expansion.
The Payout Spectrum
- 0% to 40% (High Growth / Reinvestment): Common among mature technology firms (e.g., Apple, Microsoft, Broadcom). These businesses return cash to shareholders while retaining the vast majority of capital to finance R&D, acquisitions, and expansion. Dividends in this tier frequently grow at 8% to 15% annually.
- 41% to 65% (The Dividend Sweet Spot): The gold standard for blue-chip operators (e.g., Johnson & Johnson, Procter & Gamble, PepsiCo). The business distributes reliable cash flow to owners while preserving a large capital cushion against recessions.
- 66% to 85% (Mature Income Assets): Acceptable for capital-intensive regulated utilities and infrastructure assets with legally mandated monopolies and inelastic consumer demand.
- 85%+ (The Value Trap Hazard Zone): Highly dangerous for general equities. The company has zero operating margin for error. A minor downturn in consumer demand or supply chain shock forces debt issuance to cover dividend checks. A cut is inevitable.
4. Dividend Aristocrats vs. Kings: Institutional Hallmarks of Quality
When selecting individual stocks or dedicated ETFs, investors should study the criteria that define the market's elite dividend franchises:
S&P 500 Dividend Aristocrats
To qualify as an S&P 500 Dividend Aristocrat, a company must satisfy four rigid institutional filters:
- Member of the S&P 500 index.
- Market capitalization of at least $3 billion.
- Average daily trading volume of at least $5 million.
- Must have increased its base dividend per share every consecutive year for at least 25 consecutive years.
Consider the economic implications of a 25-year streak: these enterprises successfully grew their dividend distributions through the 2000 Dot-Com crash, the 2008 Global Financial Crisis, the 2020 global pandemic, and the 2022 inflationary spike. This resilience proves the existence of an unassailable economic moat.
Dividend Kings
An even more exclusive tier comprising companies that have increased their annual payouts for 50 or more consecutive years. Notable examples include:
- Procter & Gamble (PG): 67+ years of consecutive dividend hikes.
- Johnson & Johnson (JNJ): 62+ years of consecutive dividend hikes.
- The Coca-Cola Company (KO): 62+ years of consecutive dividend hikes.
These companies sell low-cost, repeatable consumer staples with pricing power that naturally keeps pace with inflation.
5. The Five-Pillar Portfolio Allocation Model
A common strategic mistake is concentrating exclusively in high-yielding consumer staples or utilities, which underperforms during technology-led economic expansions. An institutional-grade DGI portfolio combines high current yield with high dividend growth rates across five sectors:
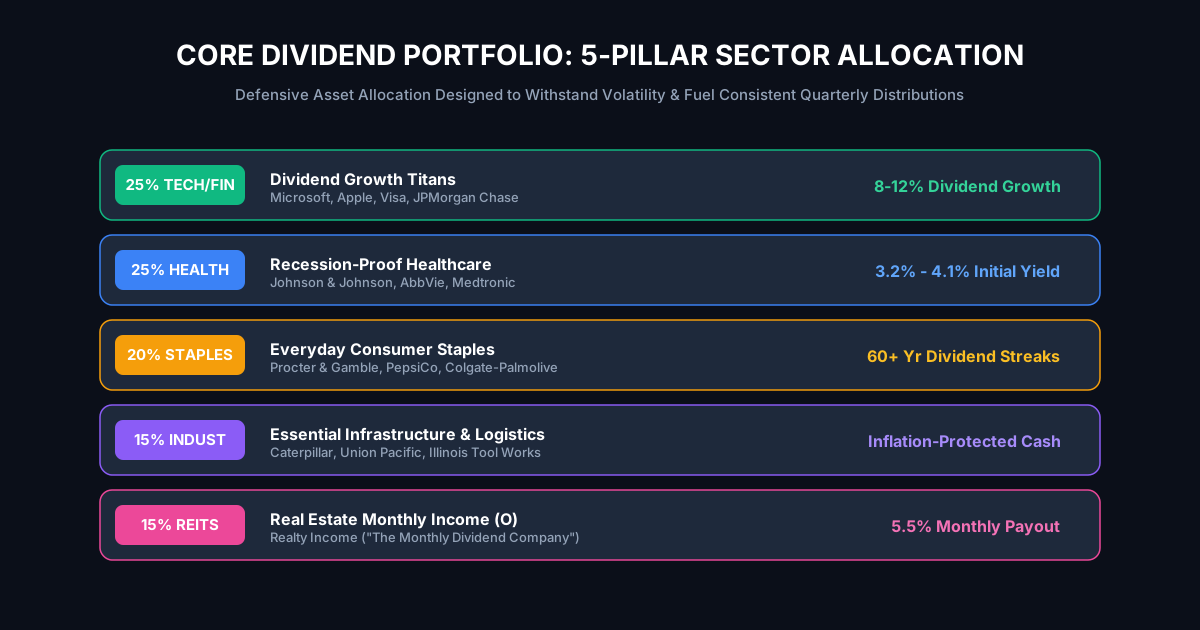 Figure 4: Defensive asset allocation architecture balancing technology dividend growers, recession-proof healthcare, consumer staples, industrials, and monthly real estate income.
| Sector / Role | Target Weight | Typical Yield | Expected Dividend Growth | Representative Holdings |
|---|---|---|---|---|
| Technology & Financials | 25% | 1.0% - 2.5% | 8% - 14% | Microsoft (MSFT), Apple (AAPL), Visa (V), JPMorgan (JPM) |
| Healthcare | 25% | 2.5% - 4.0% | 4% - 7% | Johnson & Johnson (JNJ), AbbVie (ABBV), Medtronic (MDT) |
| Consumer Staples | 20% | 2.5% - 3.5% | 4% - 6% | Procter & Gamble (PG), PepsiCo (PEP), Colgate-Palmolive (CL) |
| Industrials & Materials | 15% | 1.8% - 3.0% | 6% - 9% | Caterpillar (CAT), Union Pacific (UNP), Illinois Tool Works (ITW) |
| Real Estate (REITs) | 15% | 4.5% - 6.0% | 2% - 4% | Realty Income (O), Digital Realty Trust (DLR) |
The Power of Monthly Dividends (Realty Income)
Including commercial REITs like Realty Income (NYSE: O) provides a structural psychological advantage. By paying dividends on the 15th of every month rather than quarterly, compounding accelerates and cash flow aligns directly with standard monthly living bills.
6. The Index Alternative: Premier Dividend Growth ETFs
For investors who do not wish to audit corporate 10-K filings, track quarterly free cash flow, and manage individual equities, institutional ETFs package this strategy with negligible expense ratios:
1. Schwab U.S. Dividend Equity ETF (SCHD)
The benchmark standard among retail and institutional dividend investors.
- Expense Ratio: 0.06% ($6 per $10,000 invested).
- Index Methodology: Tracks the Dow Jones U.S. Dividend 100 Index. Screens companies based on 10 consecutive years of dividend payments, cash flow-to-total debt, return on equity (ROE), indicated dividend yield, and five-year dividend growth rate.
- Historical Performance: Has delivered exceptional dividend growth averaging ~10% annually over the past decade.
2. Vanguard Dividend Appreciation ETF (VIG)
Focuses strictly on dividend consistency and growth rather than current yield.
- Expense Ratio: 0.06%.
- Screening Rule: Requires at least 10 consecutive years of increasing regular annual dividend payments. Excludes the top 25% highest-yielding qualifying companies to eliminate potential value traps.
7. Tax Architecture: Qualified vs. Ordinary Dividends
To maximize real compounding velocity, dividend investors must understand the tax treatment of their distributions:
Qualified Dividends
Most dividends paid by domestic US corporations and qualifying foreign enterprises are categorized as Qualified Dividends if the stock is held unhedged for more than 60 days during the 121-day period surrounding the ex-dividend date.
- Taxed at preferential long-term capital gains tax rates (0%, 15%, or 20% depending on taxable income), rather than ordinary income rates.
- This creates massive tax efficiency compared to CD interest or bond coupon payments.
Non-Qualified (Ordinary) Dividends
Distributions from Real Estate Investment Trusts (REITs), business development companies (BDCs), and certain foreign firms are taxed at ordinary federal income rates (up to 37%).
- Tactical Rule: Always position REITs and high-turnover dividend assets inside tax-advantaged accounts (Roth IRA, Traditional IRA, or 401k) to ensure 100% tax immunization.
8. Summary Checklist: The Dividend Investor's Execution Code
To construct an evergreen passive income portfolio, execute these core operational rules:
- Never buy yield alone: Eliminate any stock with a double-digit yield unless you thoroughly verify cash flow coverage.
- Require positive Free Cash Flow: A company must generate more real cash than it pays in dividends plus capital expenditures.
- Demand multi-decade consistency: Focus capital into businesses with minimum 10 to 25-year records of regular annual increases.
- Automate 100% DRIP enrollment: Never allow cash distributions to sit idle in a brokerage settlement account; let every dollar purchase fractional shares immediately.
- Diversify across defensive and growth pillars: Combine high-yield consumer staples with dividend-growing technology titans to participate in economic upside while buffering against drawdowns.
By applying this institutional blueprint, your capital compounds automatically, delivering growing quarterly cash distributions that outpace inflation and secure generational financial independence.
9. The Gordon Growth Model: Valuing Dividend Growers with Precision
Institutional value investors utilize the Gordon Growth Model (Dividend Discount Model) to calculate the intrinsic value of a dividend-paying enterprise: $$P_0 = rac{D_1}{r - g}$$
Where:
- $P_0$ = Intrinsic fair value of the share today
- $D_1$ = Projected annual dividend payment for the upcoming year
- $r$ = Required rate of return (investor's discount rate, typically 8% to 10%)
- $g$ = Sustainable constant annual dividend growth rate
Applied Calculation Example
Suppose a consumer staple franchise currently pays $3.00 in annual dividends. You expect dividends to grow at a sustainable rate of 5.5% annually, and your required hurdle rate is 9.0%: $$D_1 = $3.00 imes 1.055 = $3.165$$ $$P_0 = rac{$3.165}{0.09 - 0.055} = rac{$3.165}{0.035} = $90.43$$
If the stock is currently trading on the New York Stock Exchange at $78.00, it trades at a 13.7% margin of safety relative to its intrinsic cash flow value. If the stock trades at $115.00, it is overvalued regardless of its quality. Combining fundamental dividend growth analysis with discounted cash flow models protects capital against multiple compression.
10. Historical Case Study: Compounding Titans vs. The Collapse of General Electric
The importance of screening for real operating cash flow is demonstrated by contrasting two corporate icons: Johnson & Johnson (JNJ) versus General Electric (GE) between 2000 and 2020.
Johnson & Johnson: The Textbook Aristocrat
Throughout the two decades, J&J maintained:
- Free cash flow payout ratios consistently hovering between 45% and 58%.
- An AAA credit rating from Standard & Poor's (higher than the US Federal Government).
- Continuous annual dividend increases averaging 6% to 8% annually.
- An investor holding $10,000 in JNJ in 2000 saw their annual dividend payout grow from roughly $280 to over $1,400 per year, alongside substantial capital growth.
General Electric: The High-Yield Value Trap
In contrast, GE maintained a high headline yield that masked deteriorating industrial cash flows and massive debt inside its GE Capital subsidiary:
- Management funded dividends and share buybacks through debt issuance and accounting adjustments.
- In 2017–2018, free cash flow collapsed, forcing management to slash the quarterly dividend from $0.24 to $0.12, and ultimately to a symbolic penny ($0.01 per share).
- The share price plummeted over 75%, erasing tens of billions of dollars in retiree wealth.
Lesson: High yield without cash flow coverage is a warning sign. Prioritize balance sheet integrity above all else.
11. International Dividend Allocations and Foreign Withholding Taxes
Expanding a dividend portfolio globally provides exposure to European consumer monopolies and Asian industrial leaders. However, cross-border distributions trigger international tax considerations:
Foreign Withholding Taxes
Many foreign nations deduct tax at the source before distributing dividends to American investors:
- United Kingdom: 0% withholding tax on domestic corporate dividends.
- Switzerland: 35% statutory withholding tax (requires filing for treaty refunds).
- Canada: 15% withholding tax under the US-Canada Tax Treaty.
The Tax Location Rule
- When holding foreign dividend stocks (such as Canadian banks or European pharmaceutical titans) in a taxable brokerage account, US investors can claim the Foreign Tax Credit (IRS Form 1116) to offset US income taxes dollar-for-dollar.
- Conversely, holding foreign equities with withholding taxes inside a Roth IRA forfeits the foreign tax credit, resulting in unrecoverable tax drag.
12. Frequently Asked Questions: Dividend Growth Discipline
Does a company paying dividends signal that it has run out of growth opportunities?
Not for disciplined dividend growth enterprises. High-growth early-stage startups (e.g., biotech, pre-profit AI) must reinvest 100% of capital into R&D. However, mature market leaders generate billions of dollars in excess free cash flow above and beyond all profitable internal reinvestment opportunities. Returning that capital to shareholders instills management discipline, preventing reckless acquisitions and vanity projects.
What is the difference between cumulative dividend yield and dividend growth rate?
Yield is a static snapshot showing current annual income divided by market price ($3 dividend on $100 stock = 3% yield). Growth rate measures how fast that $3 payout increases year-over-year. A stock yielding 2.5% that raises its dividend 12% annually will provide far more cash flow over a decade than a stagnant stock yielding 5.0% with 0% growth.
What should an investor do when a core holding freezes its dividend?
A dividend freeze (leaving the payout unchanged for more than four consecutive quarters) is the earliest signal of business model headwinds. Immediately place the holding on probation. Review the most recent 10-Q filing to examine operating cash flow and debt obligations. If debt ratios are expanding, prepare to reallocate capital into higher-tier Aristocrats before an outright dividend cut occurs.
13. The Covered Call Overlay Strategy for Enhanced Dividend Income
For seasoned dividend growth allocators seeking to supplement organic corporate payouts, writing Covered Calls (Buy-Write Strategy) against established 100-share positions represents a battle-tested institutional technique.
How Covered Calls Enhance Cash Flow
When you own 100 shares of an elite Dividend Aristocrat (such as Johnson & Johnson trading at $160), you can sell an out-of-the-money (OTM) call option expiring in 30 to 45 days with a strike price of $170:
- Immediate Cash Inflow: An options buyer pays you an upfront cash premium (e.g., $1.50 per share, or $150 per contract).
- Three Favorable Outcomes:
- Scenario 1 (Stock Stagnates or Declines Modestly): The option expires worthless. You retain your 100 shares, keep the full $150 premium, and collect your scheduled quarterly dividend.
- Scenario 2 (Stock Rallies Modestly Below Strike): If the stock closes at $168, you keep the $800 in unrealized share appreciation, collect the $150 option premium, and keep your shares.
- Scenario 3 (Stock Rallies Violently Above $170): Your shares are called away at $170. You capture $1,000 in capital appreciation plus the $150 premium, capping maximum upside in exchange for immediate income.
By systematically writing 30-delta out-of-the-money calls on mature, slow-moving dividend payers, investors frequently boost their effective portfolio cash yield from 3.2% to 6.5%–8.0% annually, without adding leverage or speculative risks.